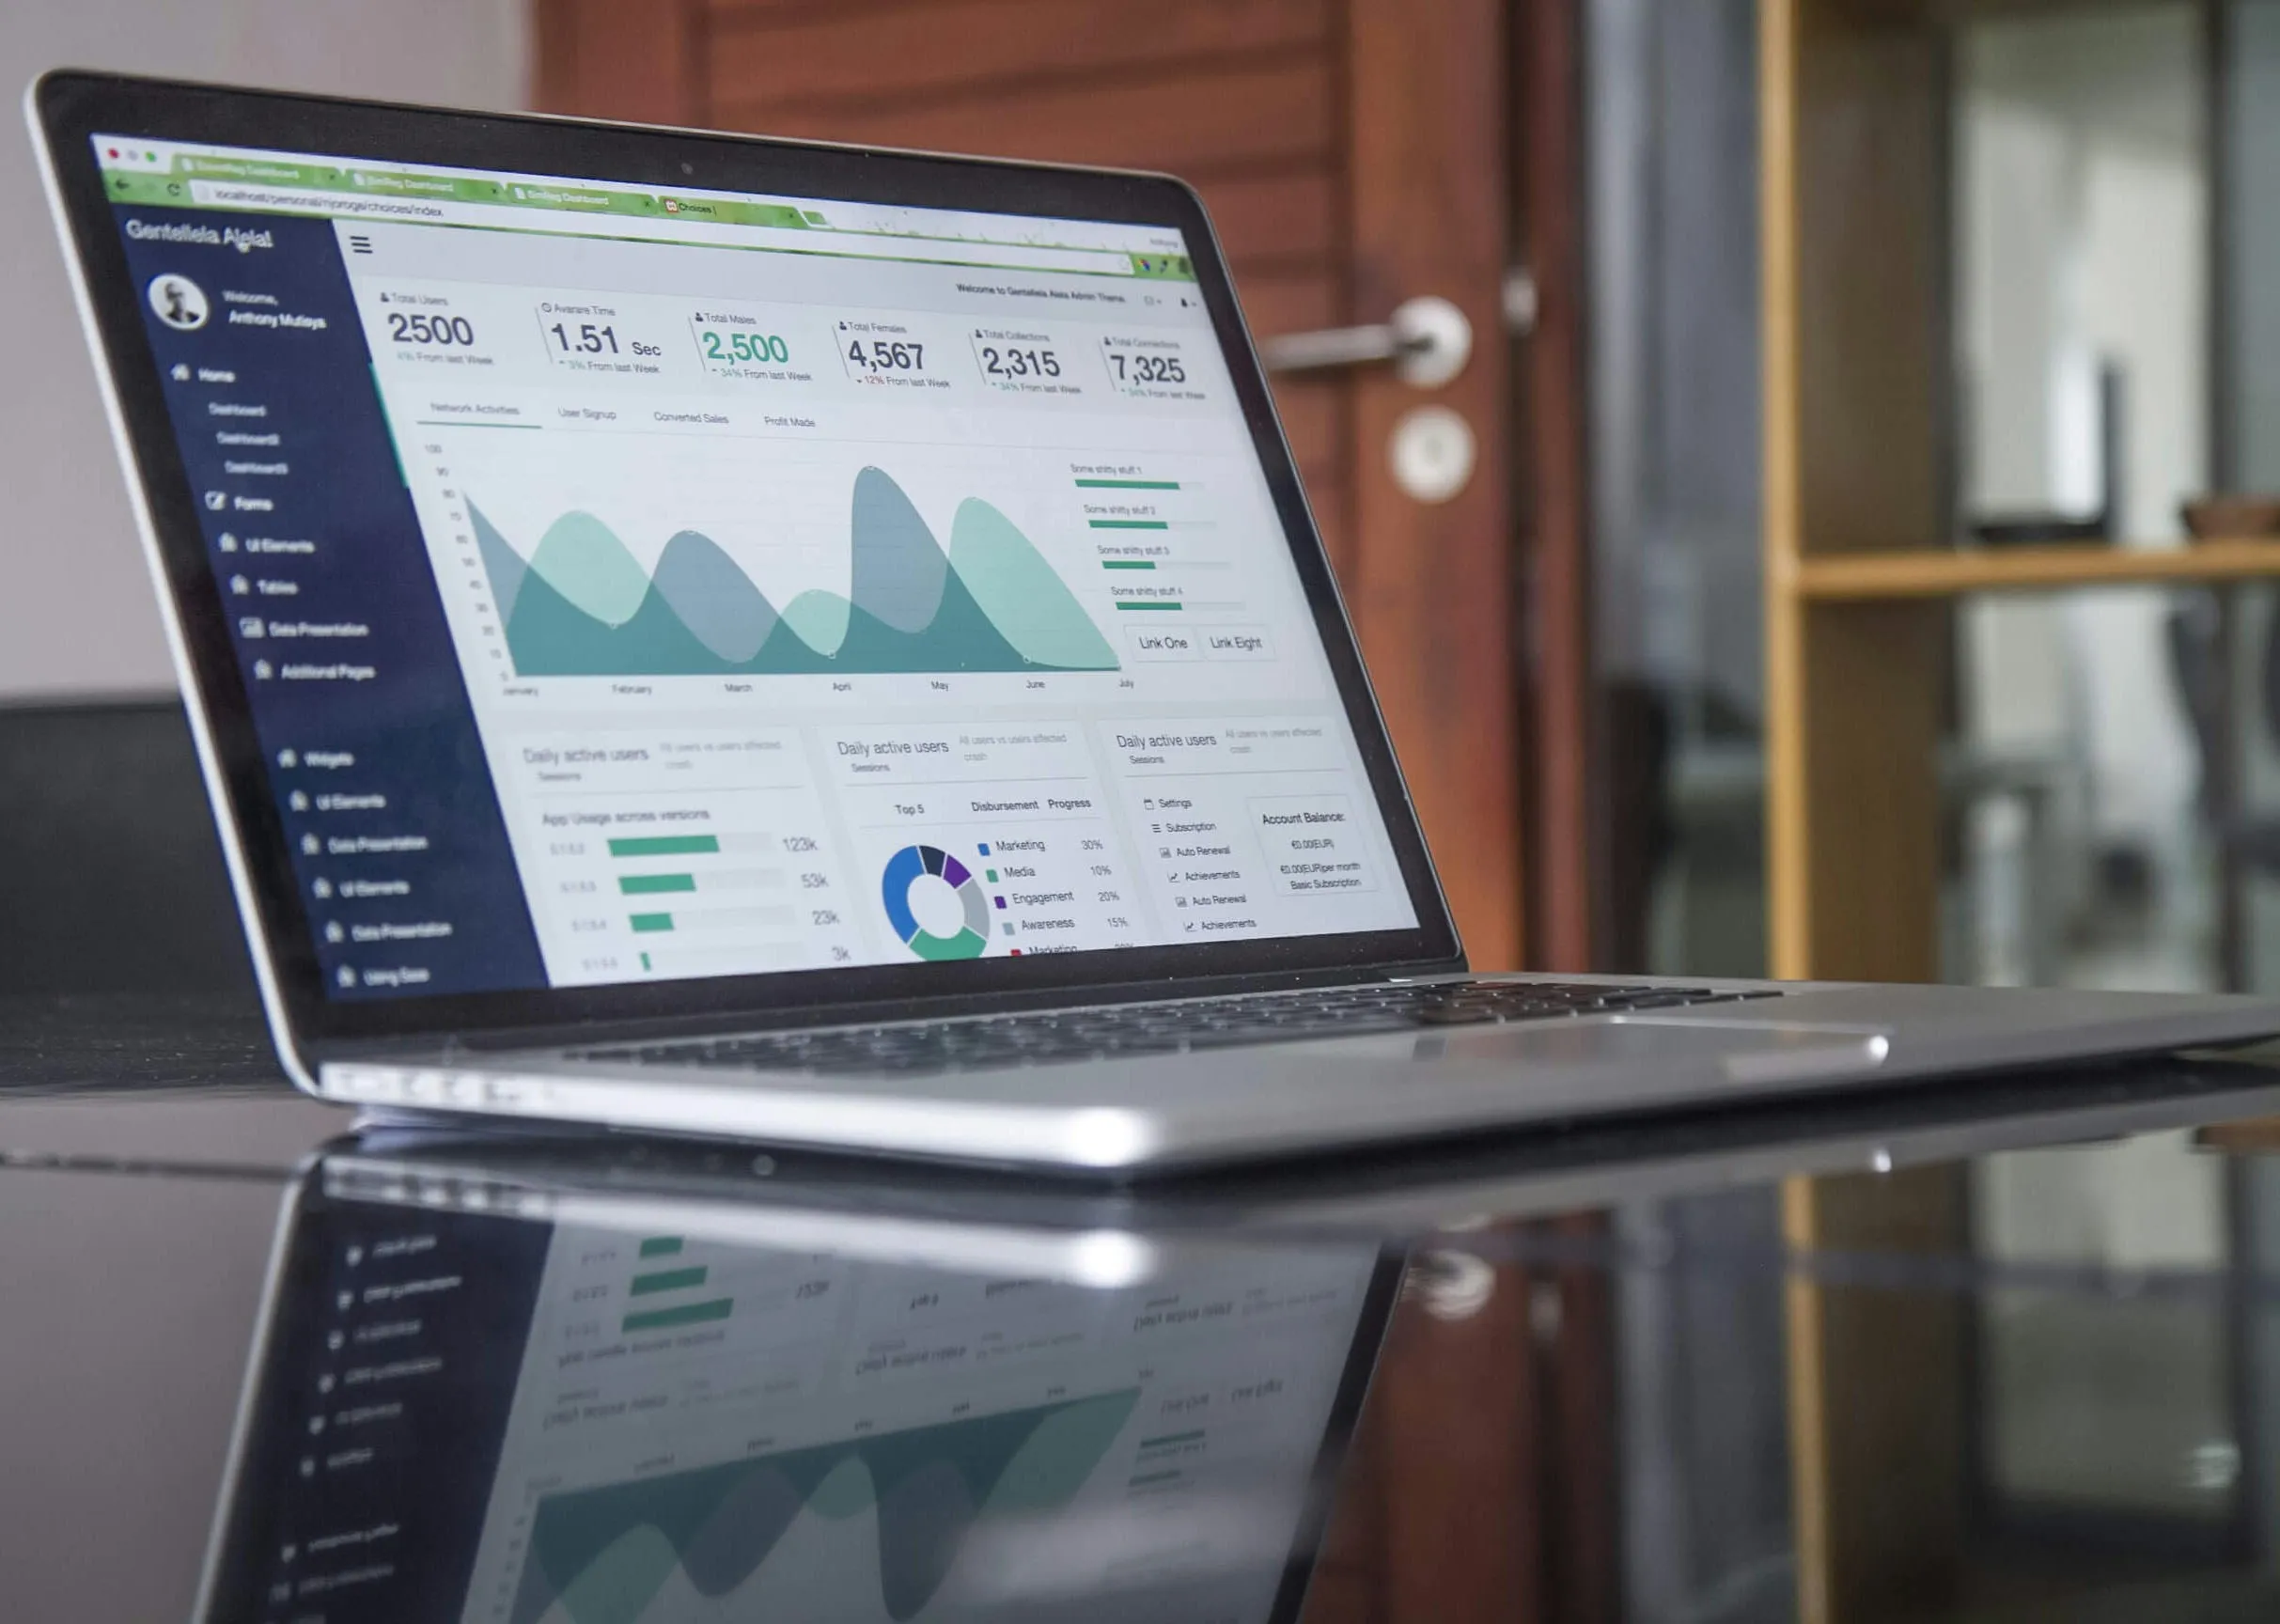
Your revenue data sits in silos
The retail team runs reports from the order system. The subscription team pulls from the billing platform. The CFO waits until month-end, combines both in a spreadsheet, and hopes nothing got doubled or dropped.
You can see both streams, reconciled, in real time.
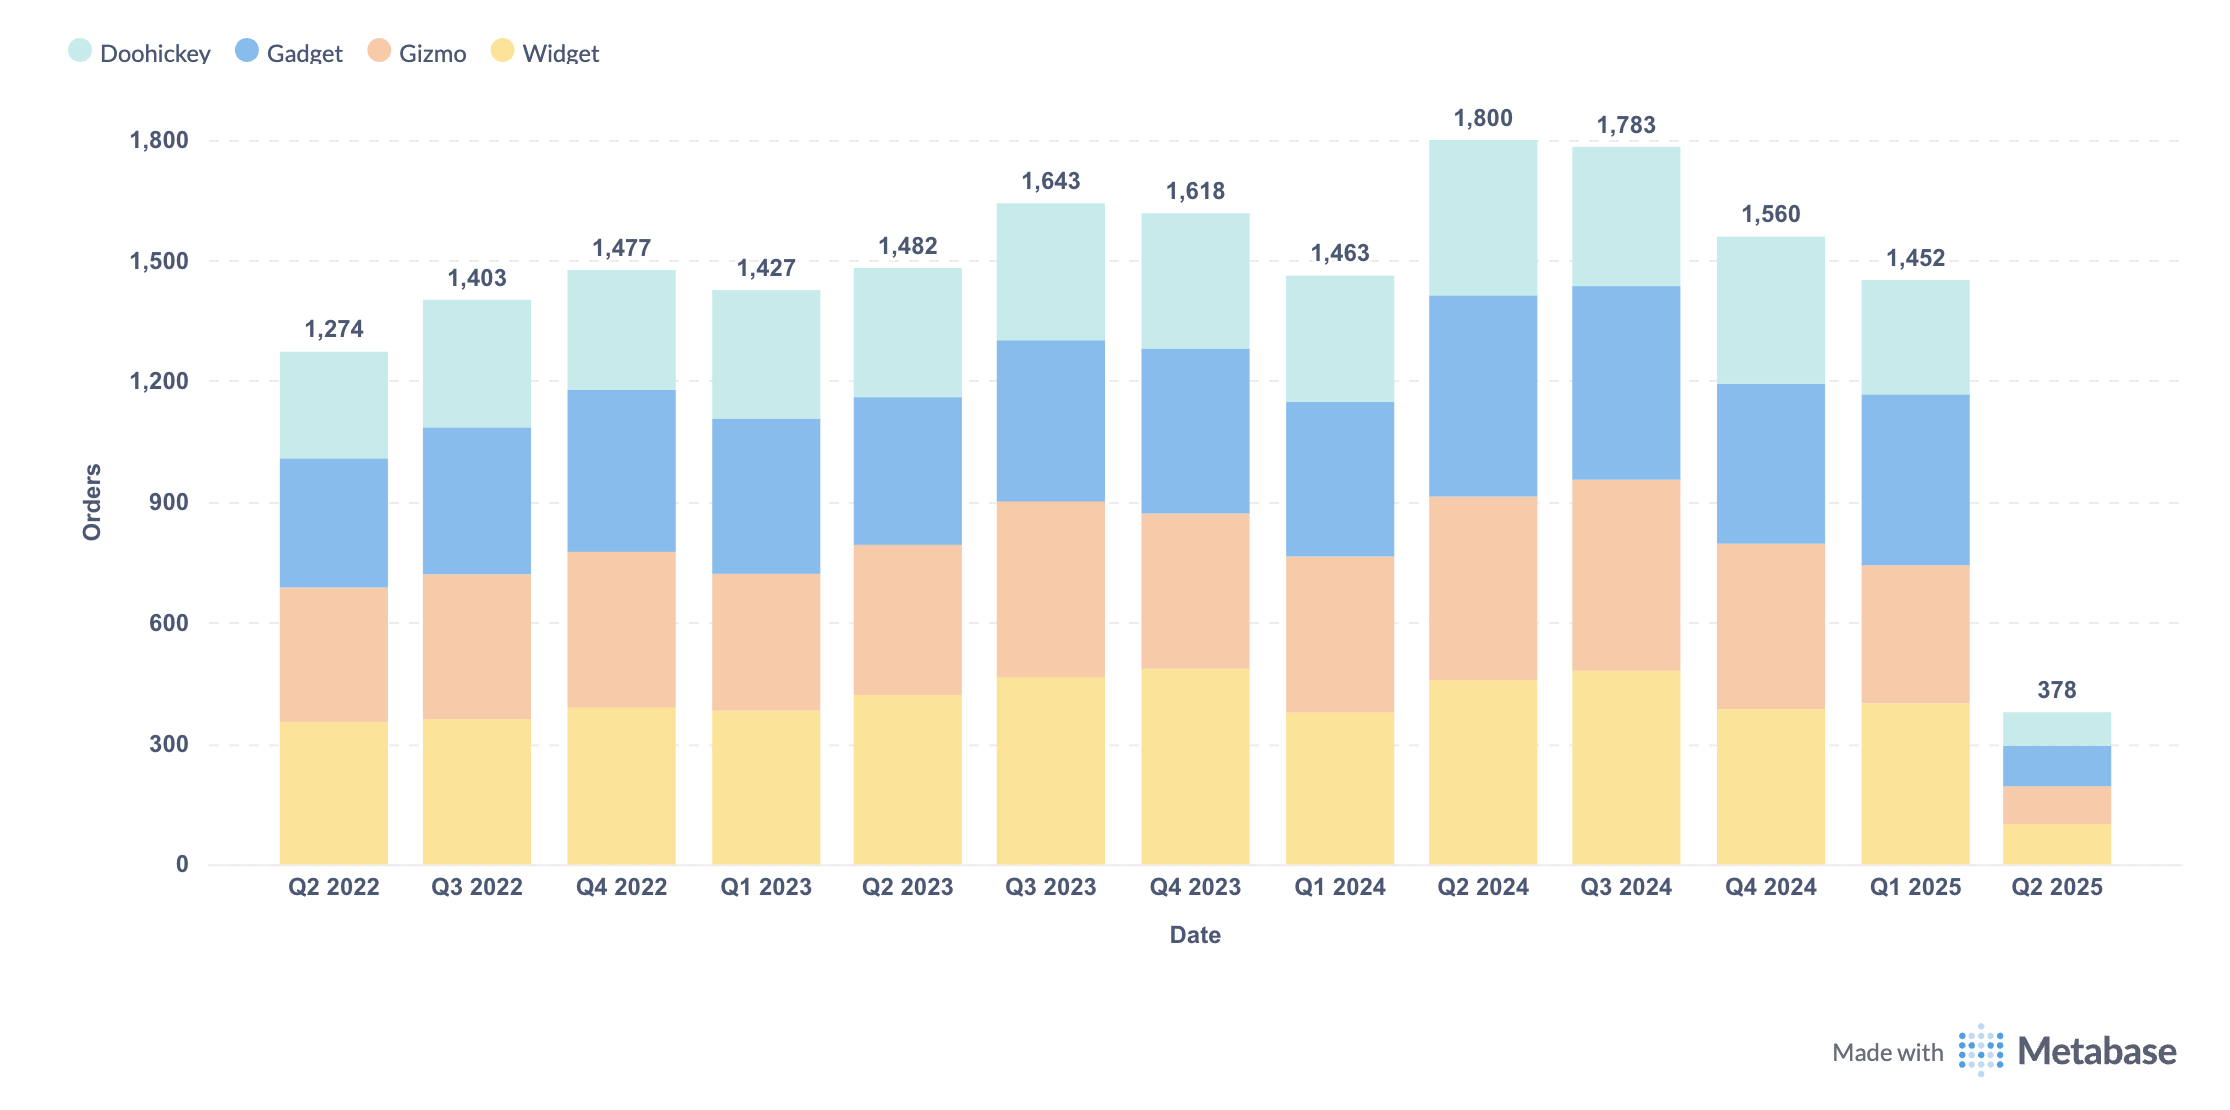
Retail view
Which products sell, where they sell, and whether demand is climbing or cooling. Heatmaps show geographic performance. Stacked bar charts break out product demand by quarter. You spot shifts before they hit inventory.
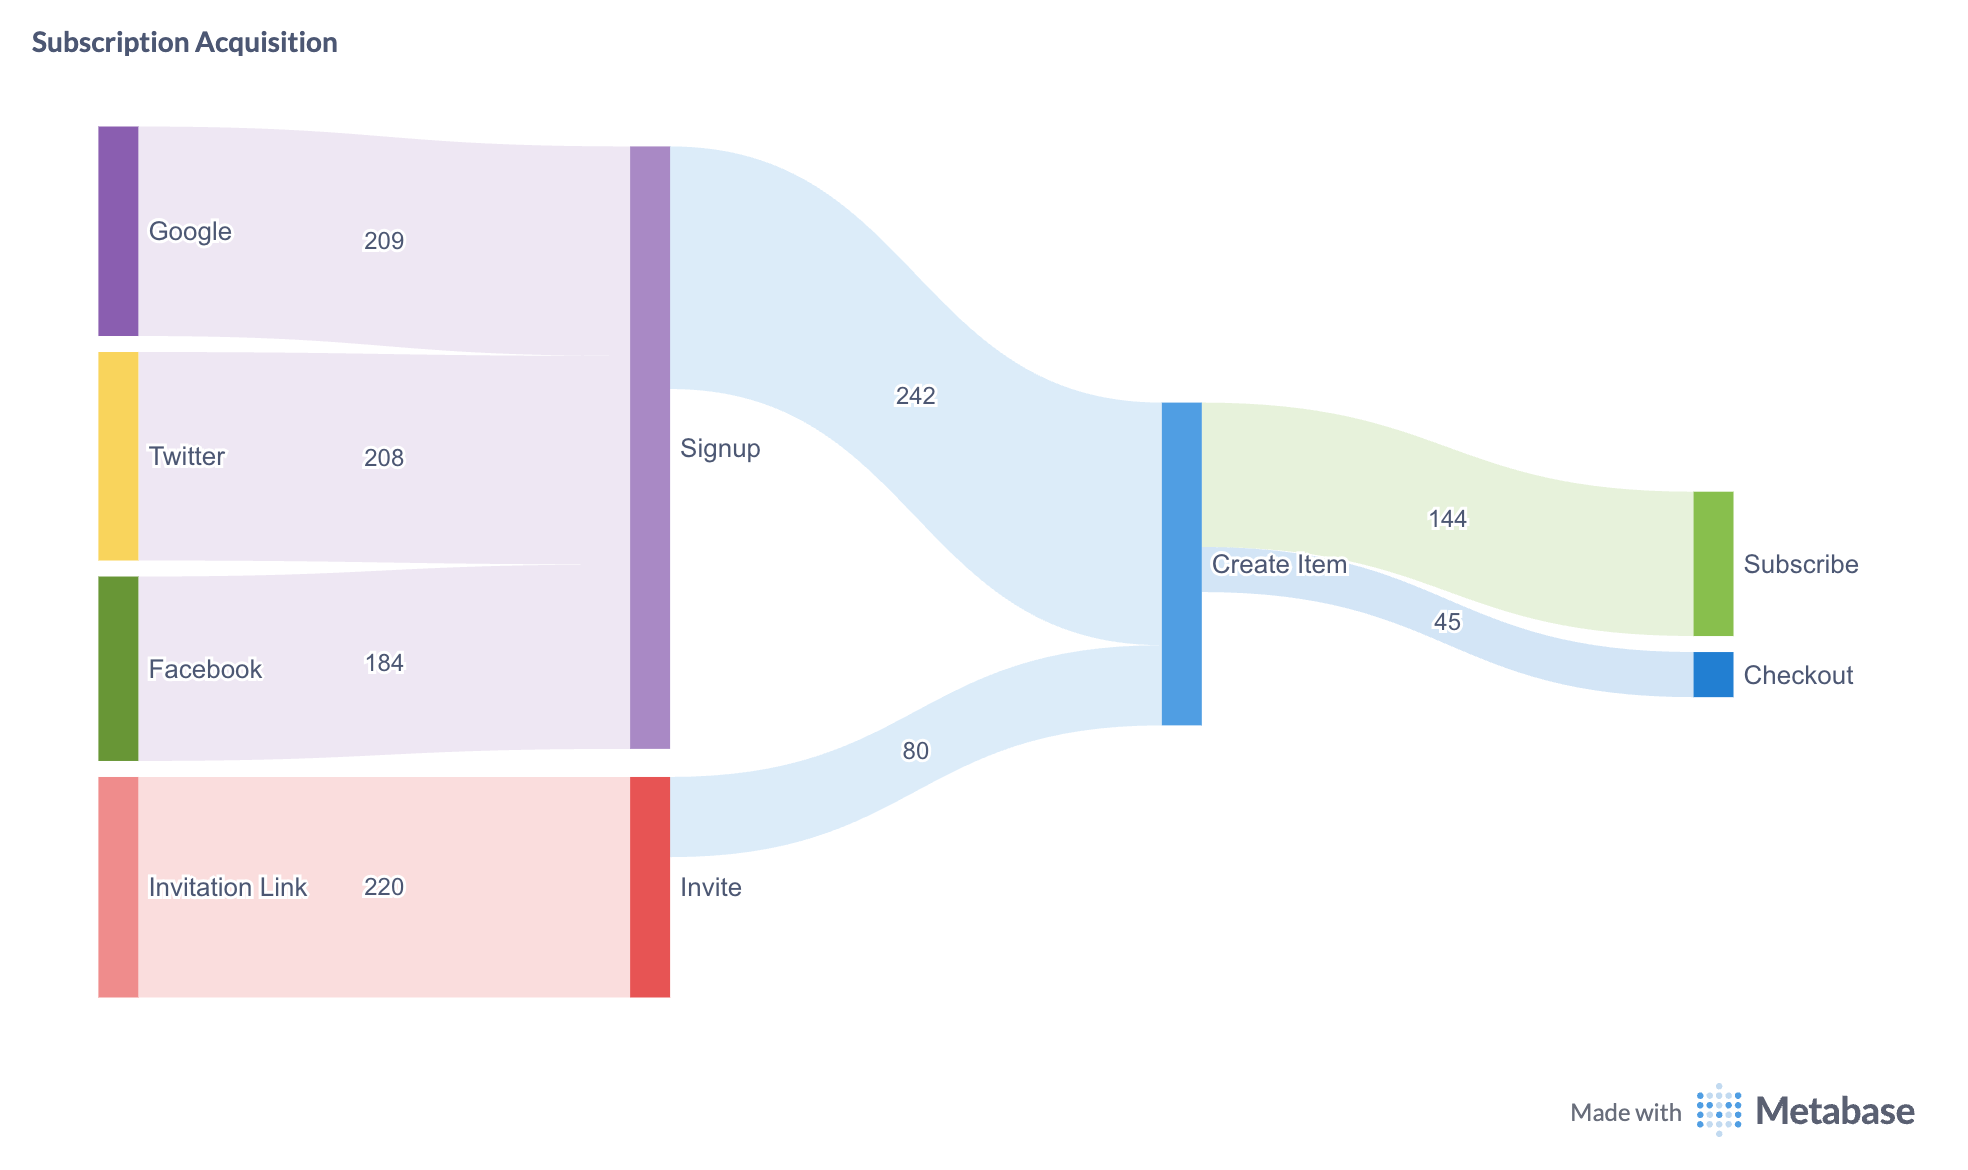
Subscription view
Acquisition channel performance. Trial-to-paid conversion rates. Customer journey from first contact through checkout. Sankey charts trace the full funnel. You trace marketing spend to outcomes, line by line.
No more reconciliation meetings
Subscription revenue and retail revenue on one screen. We built this on a unified data model. Two streams, separated at the source, shown together. One set of definitions. One refresh cycle.
Dig deeper:
- 10 SaaS Metrics Every Dashboard Needs — The metrics that drive retention and growth
- PostgreSQL for BI — Using PostgreSQL as your business intelligence backend
See the dashboard. We’ll connect your revenue data and have you running in days.