
Churn doesn’t announce itself
It shows up in falling logins first. Shorter sessions. Stalled upgrades. By the time cancellations hit revenue, the damage is done.
You can catch the signals while there’s still time to act.
Watch engagement
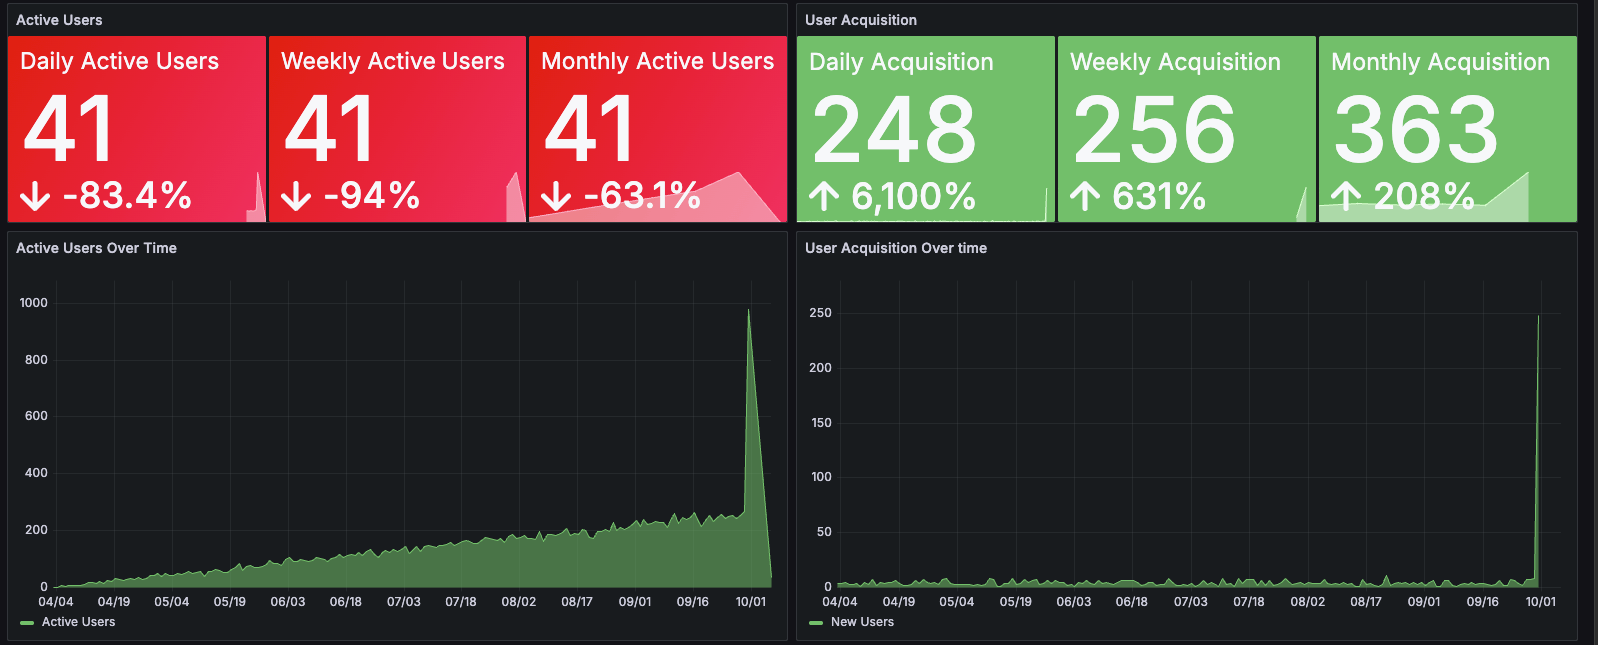
DAU, WAU, MAU. Three numbers. You see whether usage rises or falls. A spike in sign-ups without matching DAU means retention risk. Rising DAU with flat sign-ups means existing customers are deepening.
New acquisitions. A time-series chart tracks whether sign-ups accelerate or plateau.
Top markets. Which countries drive usage. Where to invest next.
Watch sessions
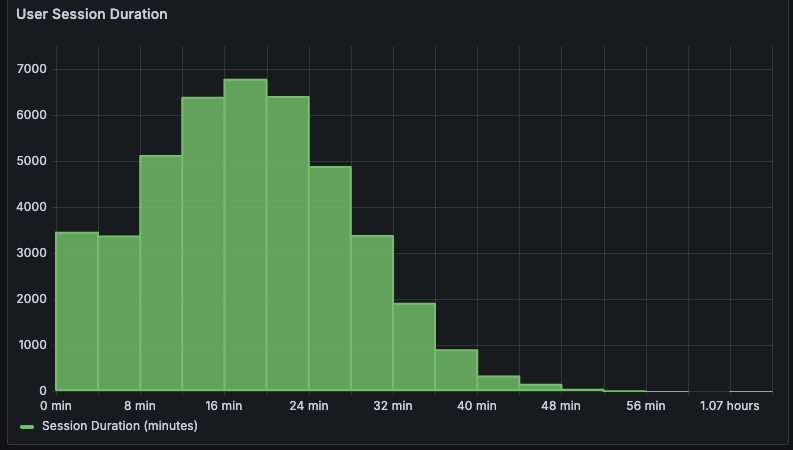
Session duration answers one question: do users find value or bounce. A histogram shows the distribution. Sessions ending in seconds mean onboarding friction. Long tails mean stickiness.
Watch revenue
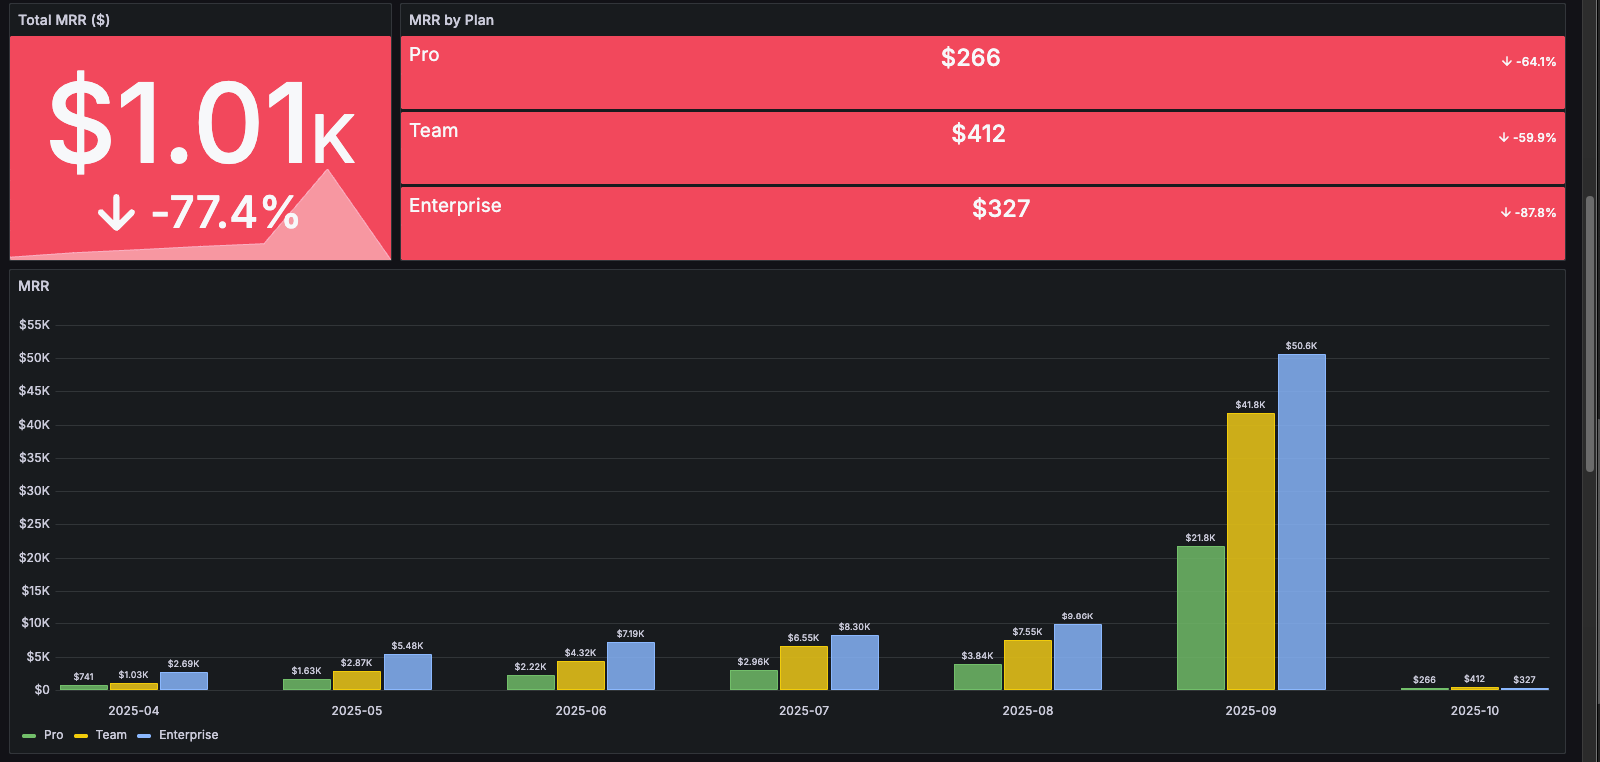
MRR. Monthly recurring revenue for the current period.
Plan breakdown. A stacked bar splits MRR across Pro, Team, and Enterprise tiers. You see which plans drive growth and where the business is overexposed.
Watch conversion
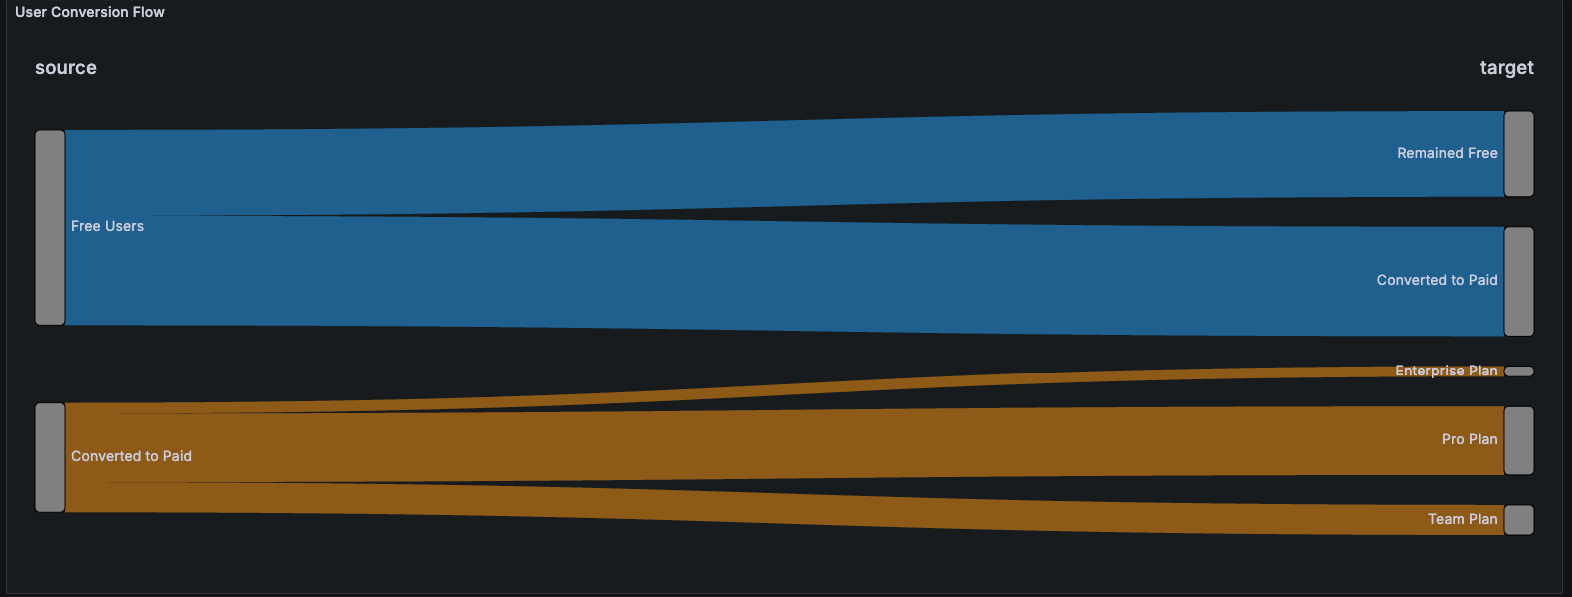
A Sankey chart maps the journey from free to trial to paid, then splits paying users across plan tiers. Large drop-offs highlight friction in onboarding. Balanced distribution across plans means your product sells across customer sizes, not just one segment.
Built on a live pipeline
We generate synthetic SaaS data through Docker, Python, and SQLite to mimic a production chat platform. Grafana connects directly and refreshes every few seconds. We deploy the same architecture for live production systems.
Dig deeper:
- 10 SaaS Metrics Every Dashboard Needs — The metrics that drive retention and growth
- Real-Time Data Pipelines — Architecting pipelines that refresh in seconds
See it live. We’ll connect your real data. Retention dashboards up in days.