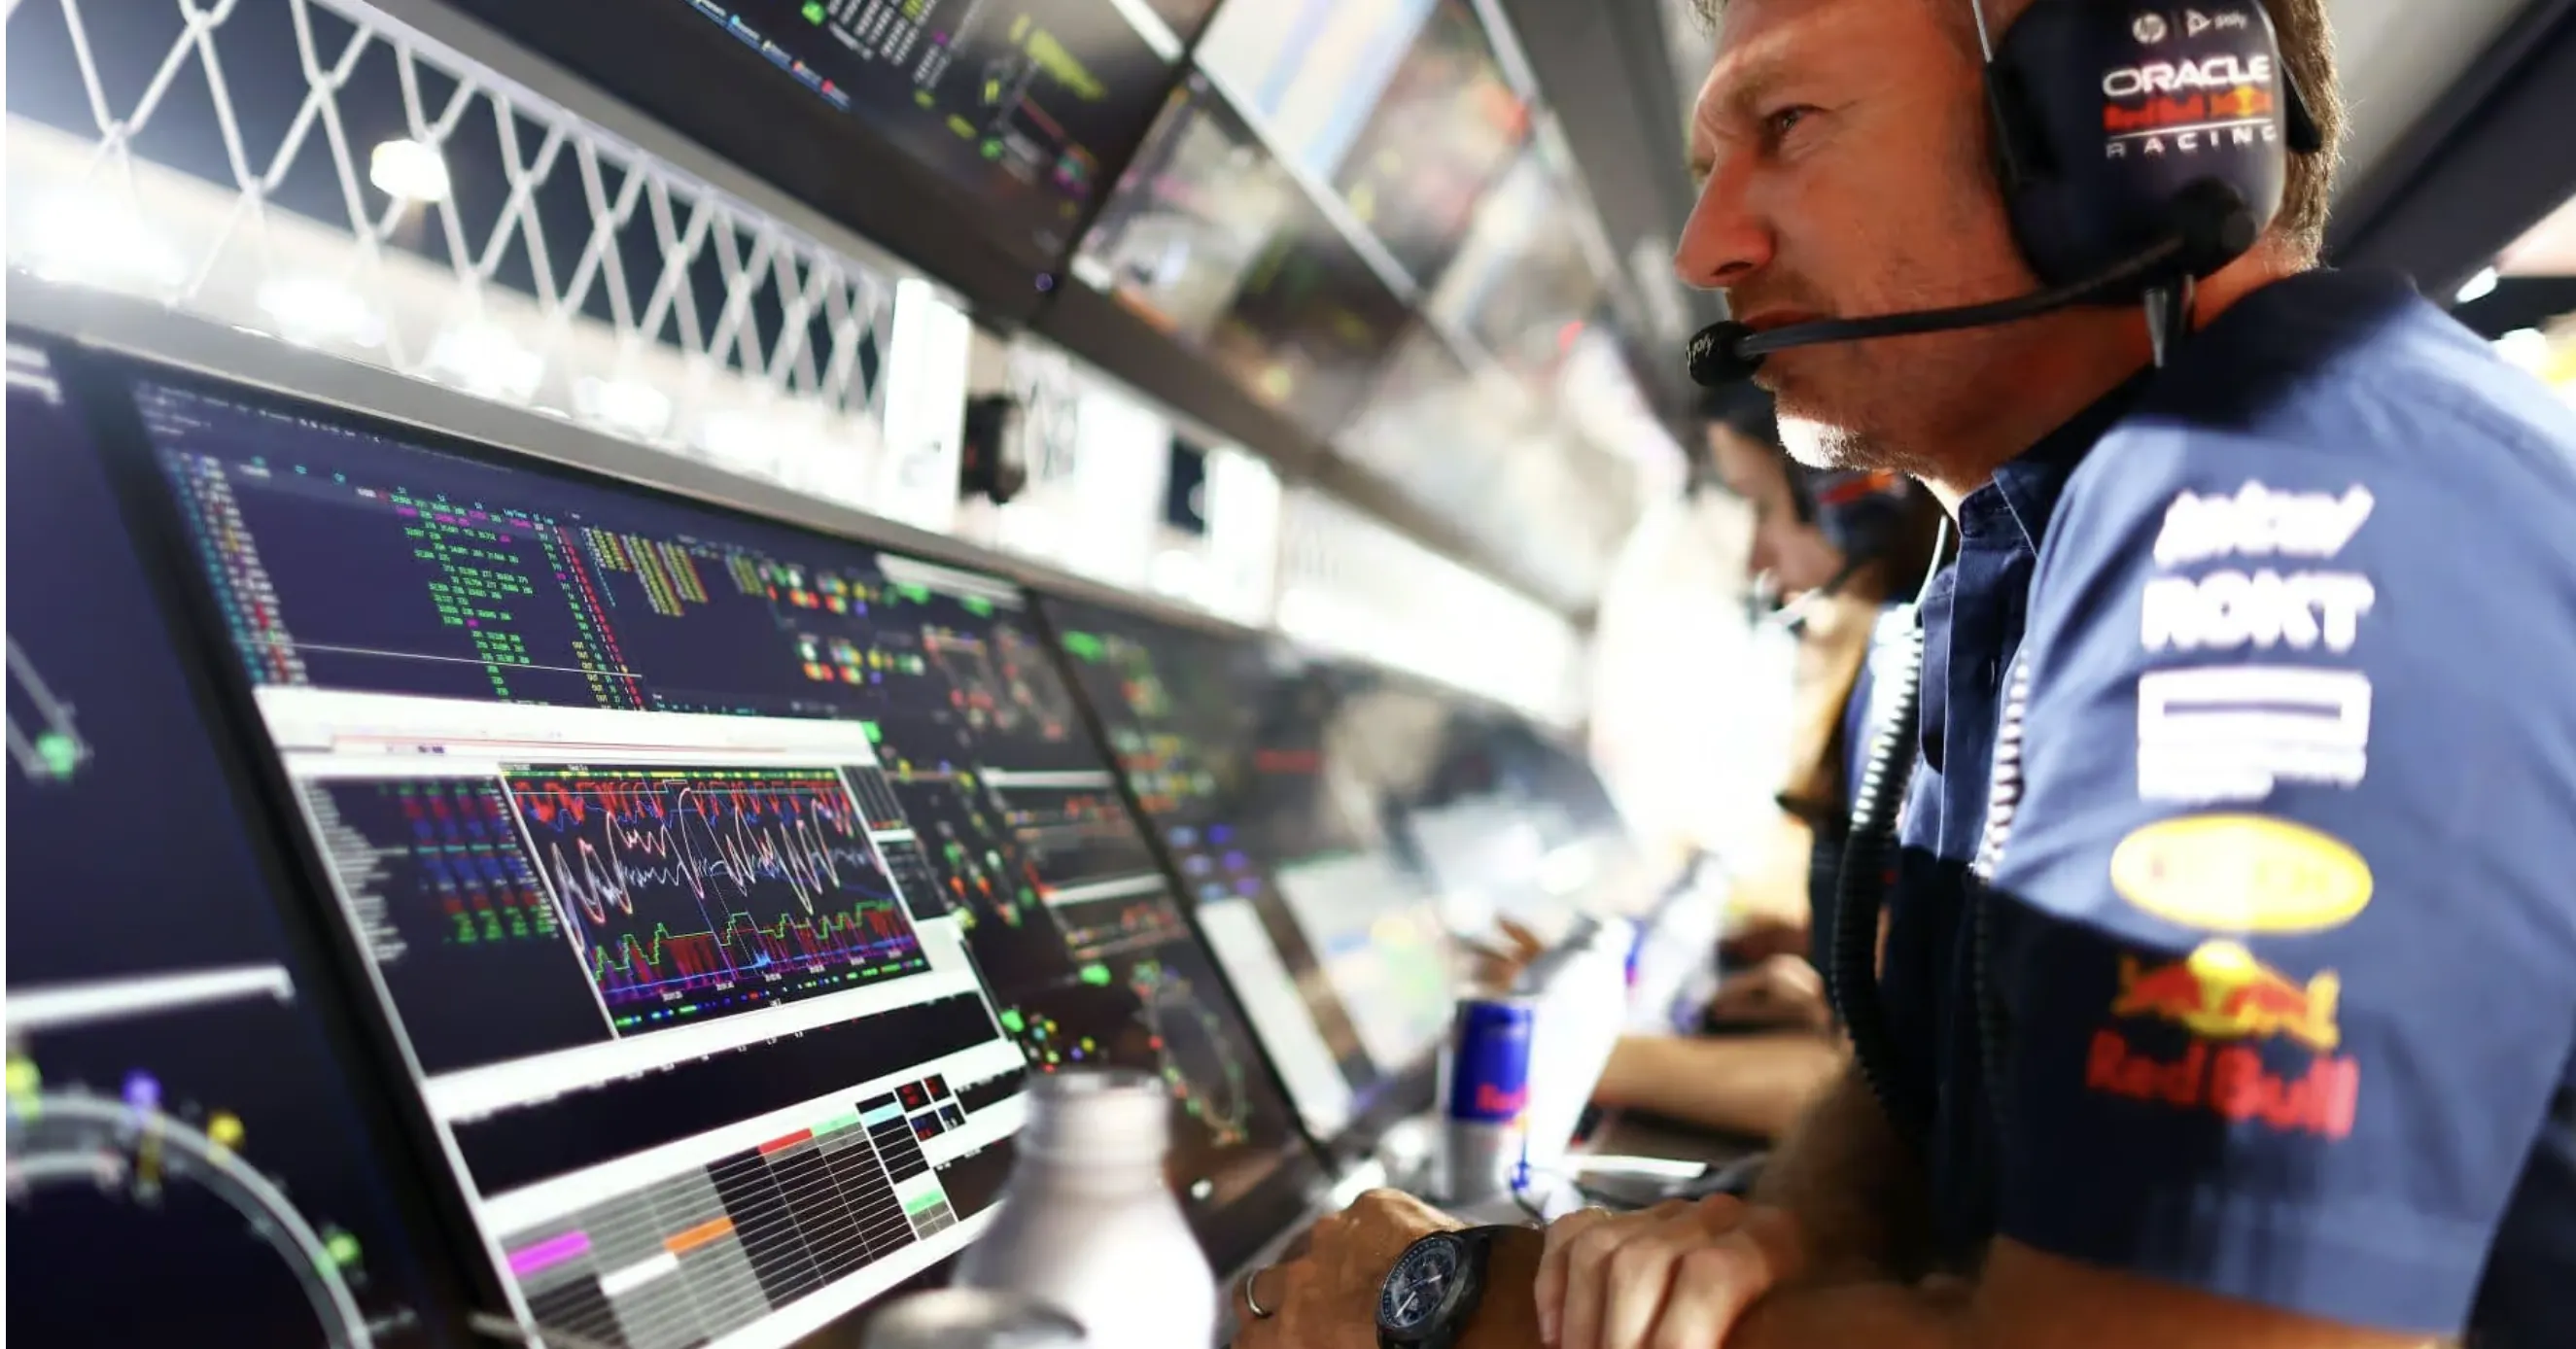
Split-second decisions win races
A modern F1 car generates millions of telemetry points per race. Throttle position. Tire temperature. Brake bias. Race engineers need one answer, right now: pit or stay out.
Five questions decide a race. This dashboard puts them on one screen.
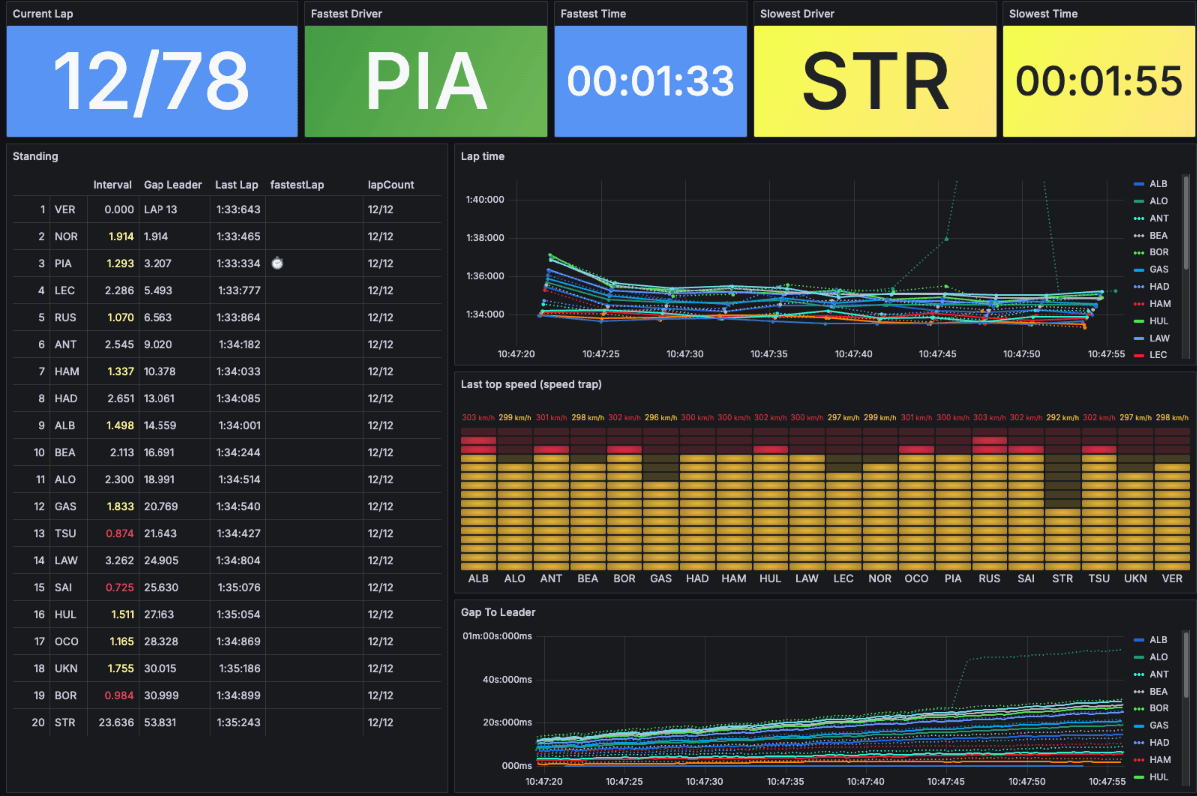
Lap times
Precision table, down to milliseconds. You see whether your driver gains or loses time on each lap. Consistent slow laps mean pit. Steady competitive times mean the strategy holds.
Intervals and gaps
Position to the car ahead. Gap to the leader. Under one second and DRS opens, overtake is on. A chasing driver closing fast means you defend or adjust.
Pace benchmark
Fastest driver on track. Slowest driver on track. If your driver sets the pace, the setup and strategy hold. If not, you know who has the benchmark and how much ground to recover.
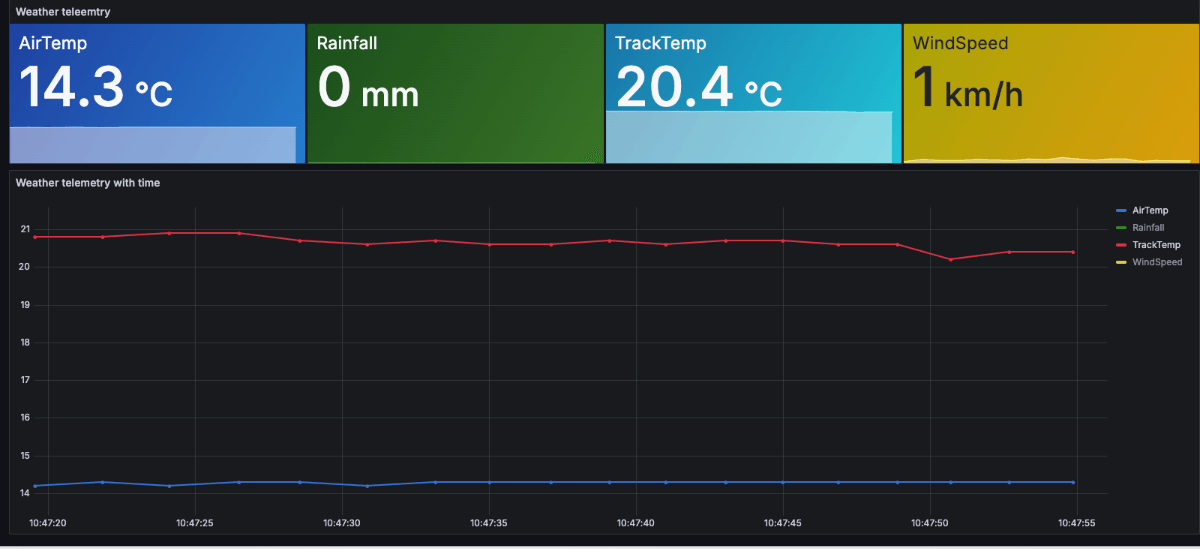
Weather
Air temperature. Track temperature. Rainfall. Wind. Slicks stay on in the dry. Rain picks up, you switch to intermediates. A headwind burns more fuel. A tailwind saves it. Weather defines pit windows. Thirty seconds either way changes the finishing order.
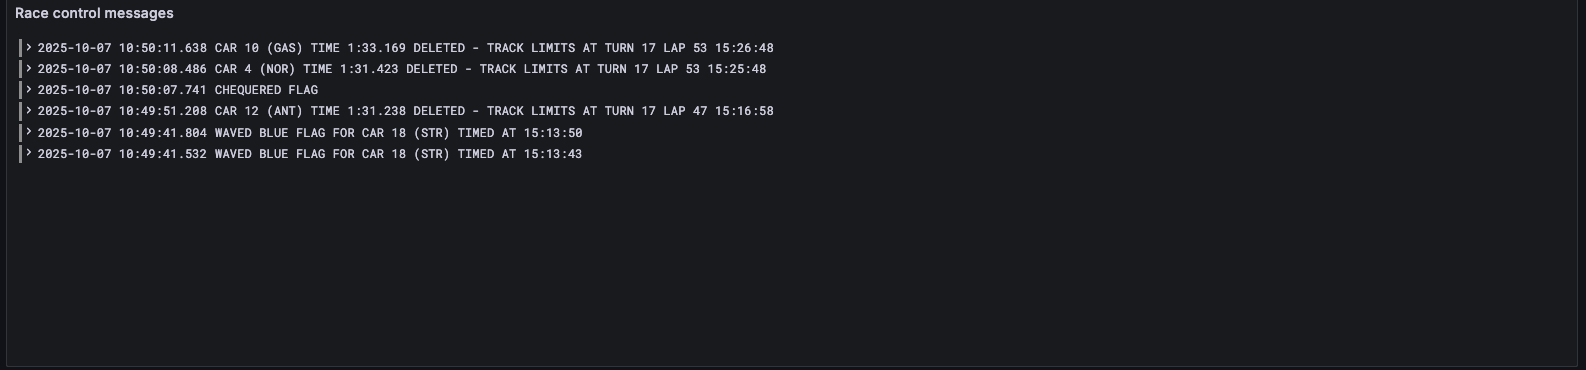
Race control
Every yellow flag. Every penalty. Every safety car, logged with a timestamp. A safety car creates a free pit stop and saves twenty seconds. Yellow flags enforce no-overtake zones. Rival penalties open positions. You exploit each regulatory shift the moment it happens.
From telemetry to strategy
We built this pipeline on FastF1, InfluxDB, and Grafana. The data flows from F1’s live timing API to the dashboard in seconds. We apply the same real-time architecture to any domain where milliseconds matter.

Dig deeper:
- Real-Time Data Pipelines — Architecting pipelines that refresh in seconds
- Metabase vs Grafana vs Superset — Compare the top three open-source BI platforms
Get the dashboard. We’ll build real-time telemetry for your domain.