
The GOAT debate, settled with data
Who was better: Hamilton or Schumacher? Senna or Prost? Fans argue. Pundits opine. Nobody checks the numbers.
This dashboard checks the numbers. Seventy-five years of F1 race data. Pick any two drivers. Compare wins, podiums, reliability, and longevity. You get the answer in seconds.
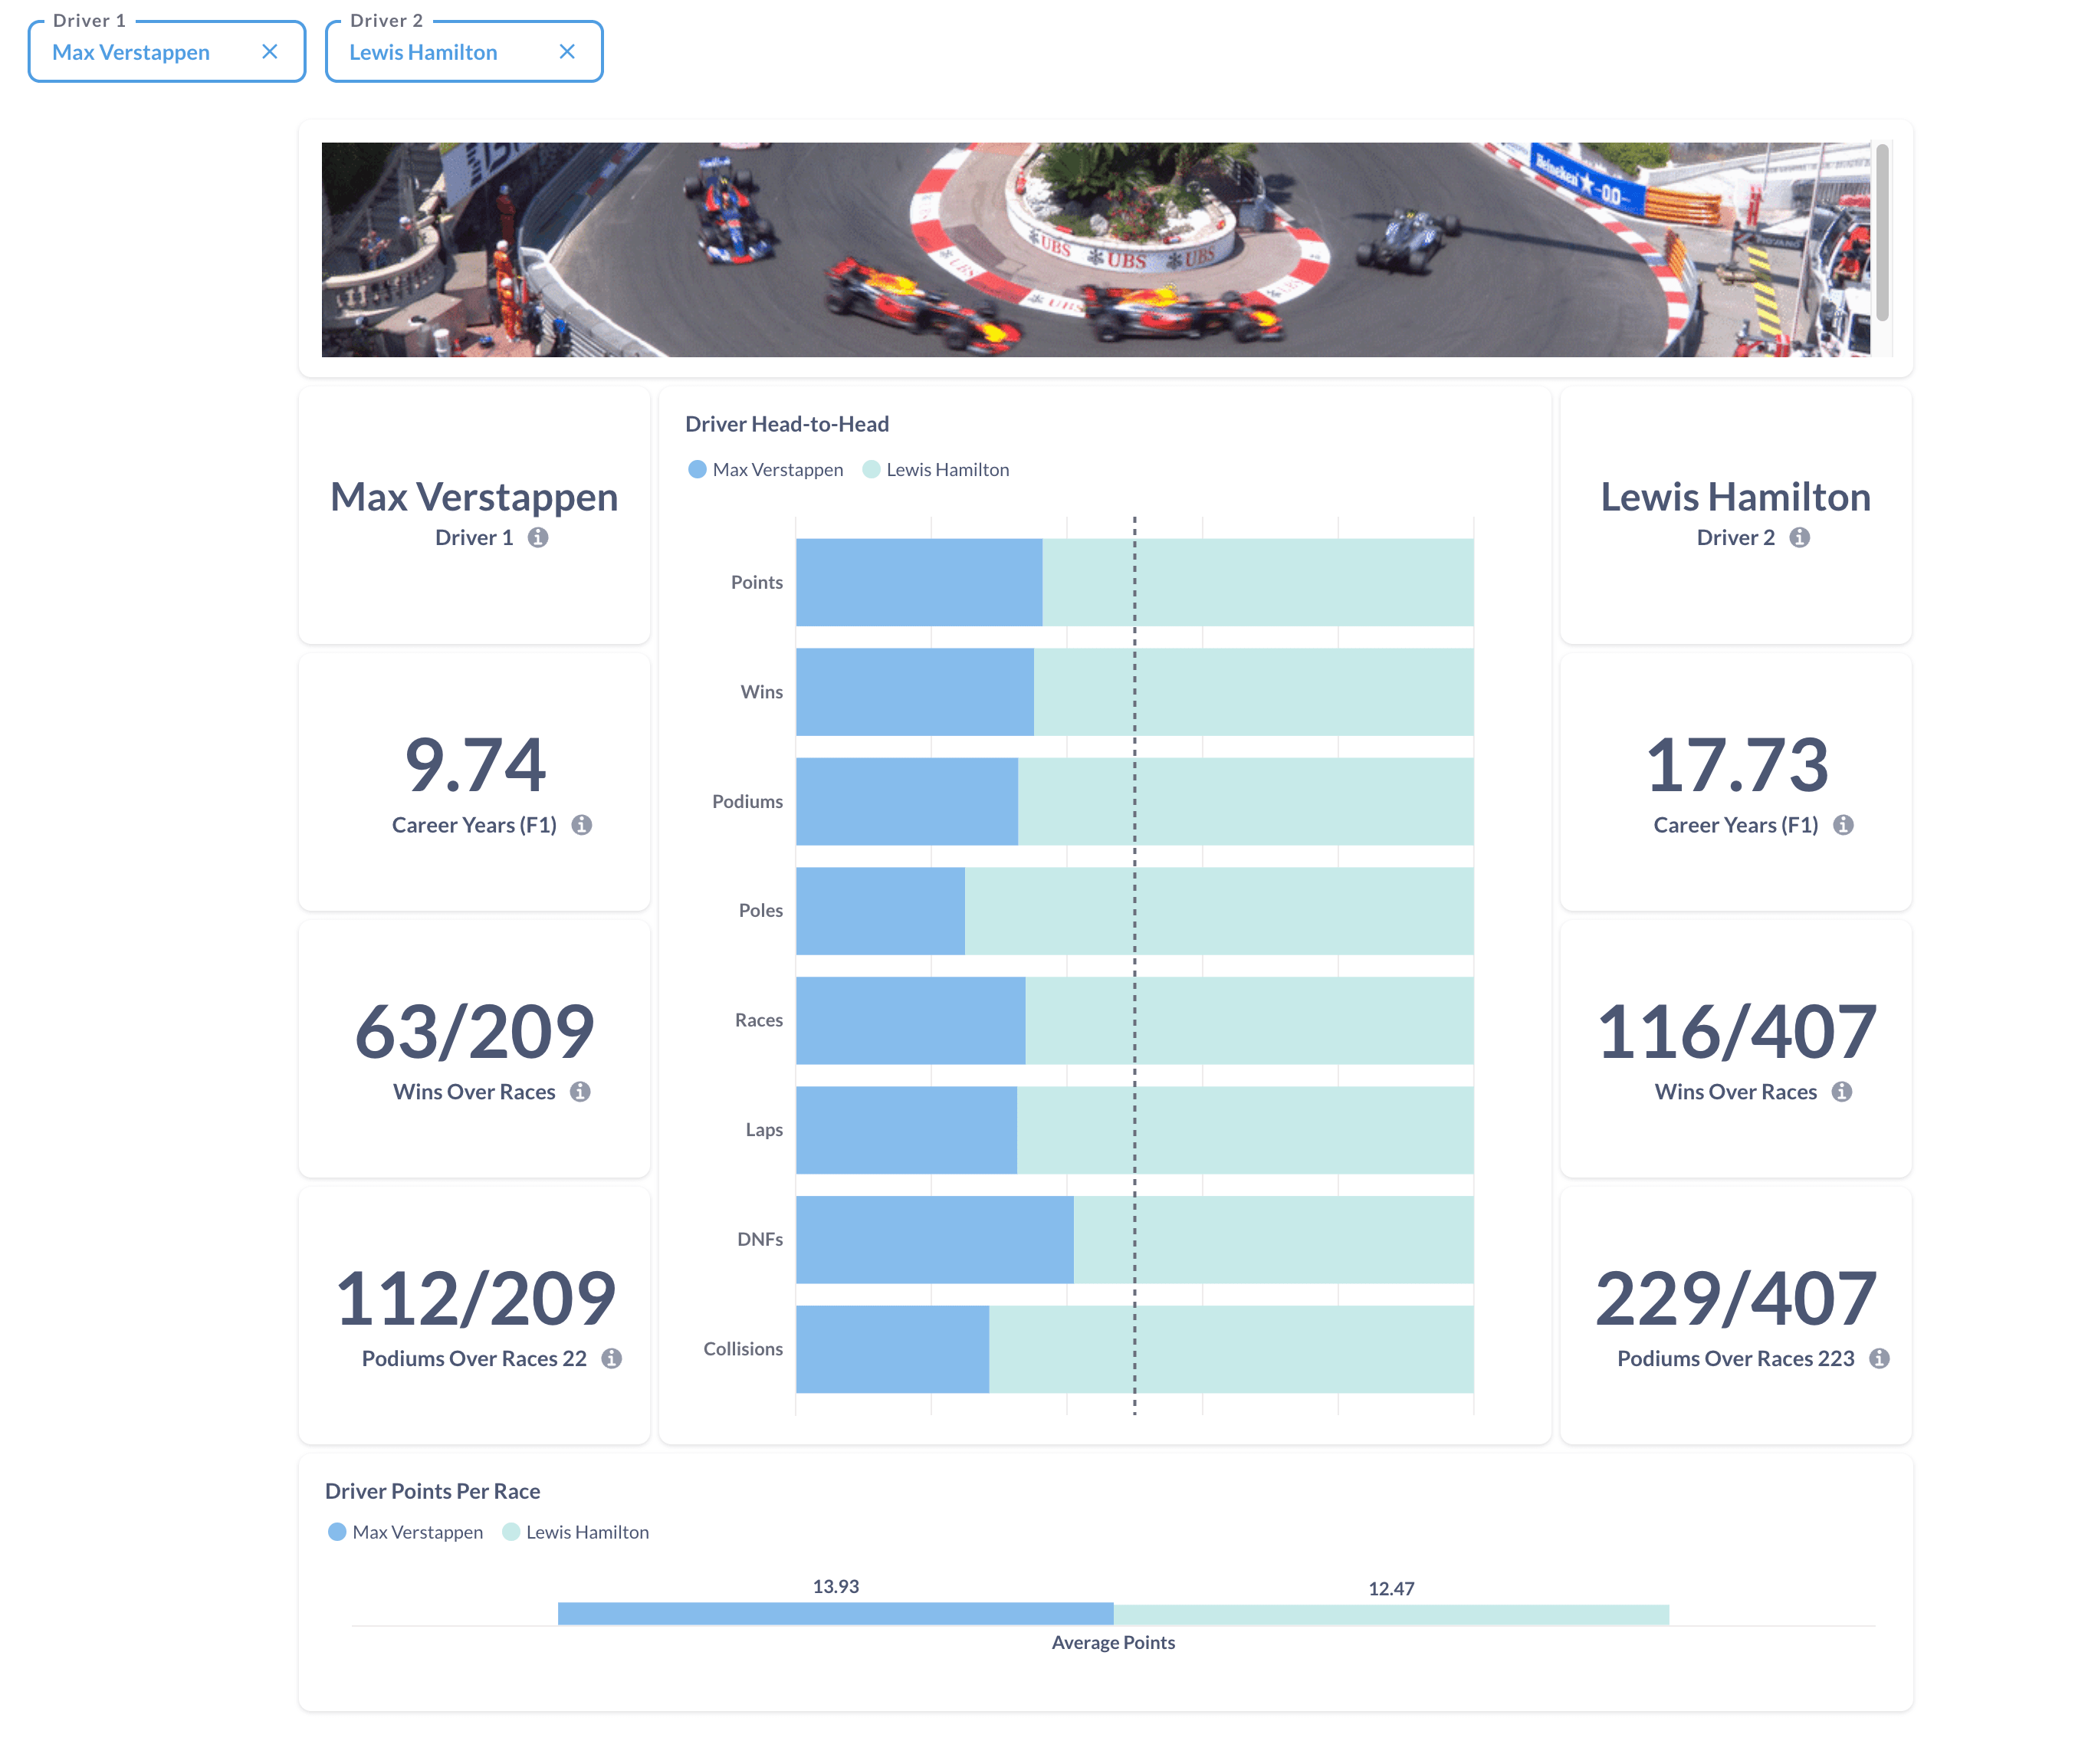
Head to head, metric by metric
Wins. Who took more checkered flags.
Podiums. Consistency matters. A driver with fewer wins but more podiums tells a different story.
DNFs. Reliability shaped careers. Some drivers lost titles to the garage, not the grid.
Points and starts. Longevity and scoring rate. Two drivers can race the same number of seasons and produce wildly different results.
Each bar splits the totals by driver. One glance, and you know who led where and by how much.
From pub argument to data-backed answer
We pulled 75 years of race records, modeled them, and built a dashboard that answers the head-to-head question on demand. The same approach applies to your business. Messy data in. Answers out.
Dig deeper:
- Metabase vs Grafana vs Superset — Compare the top three open-source BI platforms
- PostgreSQL for BI — Using PostgreSQL as your business intelligence backend
Try the dashboard. Pick your drivers and settle the argument.