Great work. Invisible results.
Crossroads Health processes millions in healthcare credit balance transactions. Their Crossfire service gives hospitals root-cause analysis to stop future credits before they accumulate. The work was excellent. Clients could not see it.
Healthcare CFOs and Revenue Cycle Directors waited on monthly PDFs. Anything between reports required a call to the account manager. Forty to fifty percent of account management time went to routine status inquiries. CRH’s operational edge was invisible to buyers. Competitors had started offering basic portals.
The problem ran deeper than reporting
The original application baked custom charts directly into the platform. Every new chart, filter, or data extract required an engineering ticket. Analysts could not serve themselves. Ad-hoc report requests backed up for days or weeks. Schema variations across client databases caused frequent discrepancies and rework. Engineering time went to reporting instead of core platform development.
Separate the analytics layer
We deployed a self-hosted Metabase instance on CRH’s own infrastructure, layered on their existing PostgreSQL databases. Everything stays in-house. Full HIPAA compliance. Full SOC2 certification. No patient data leaves their environment.
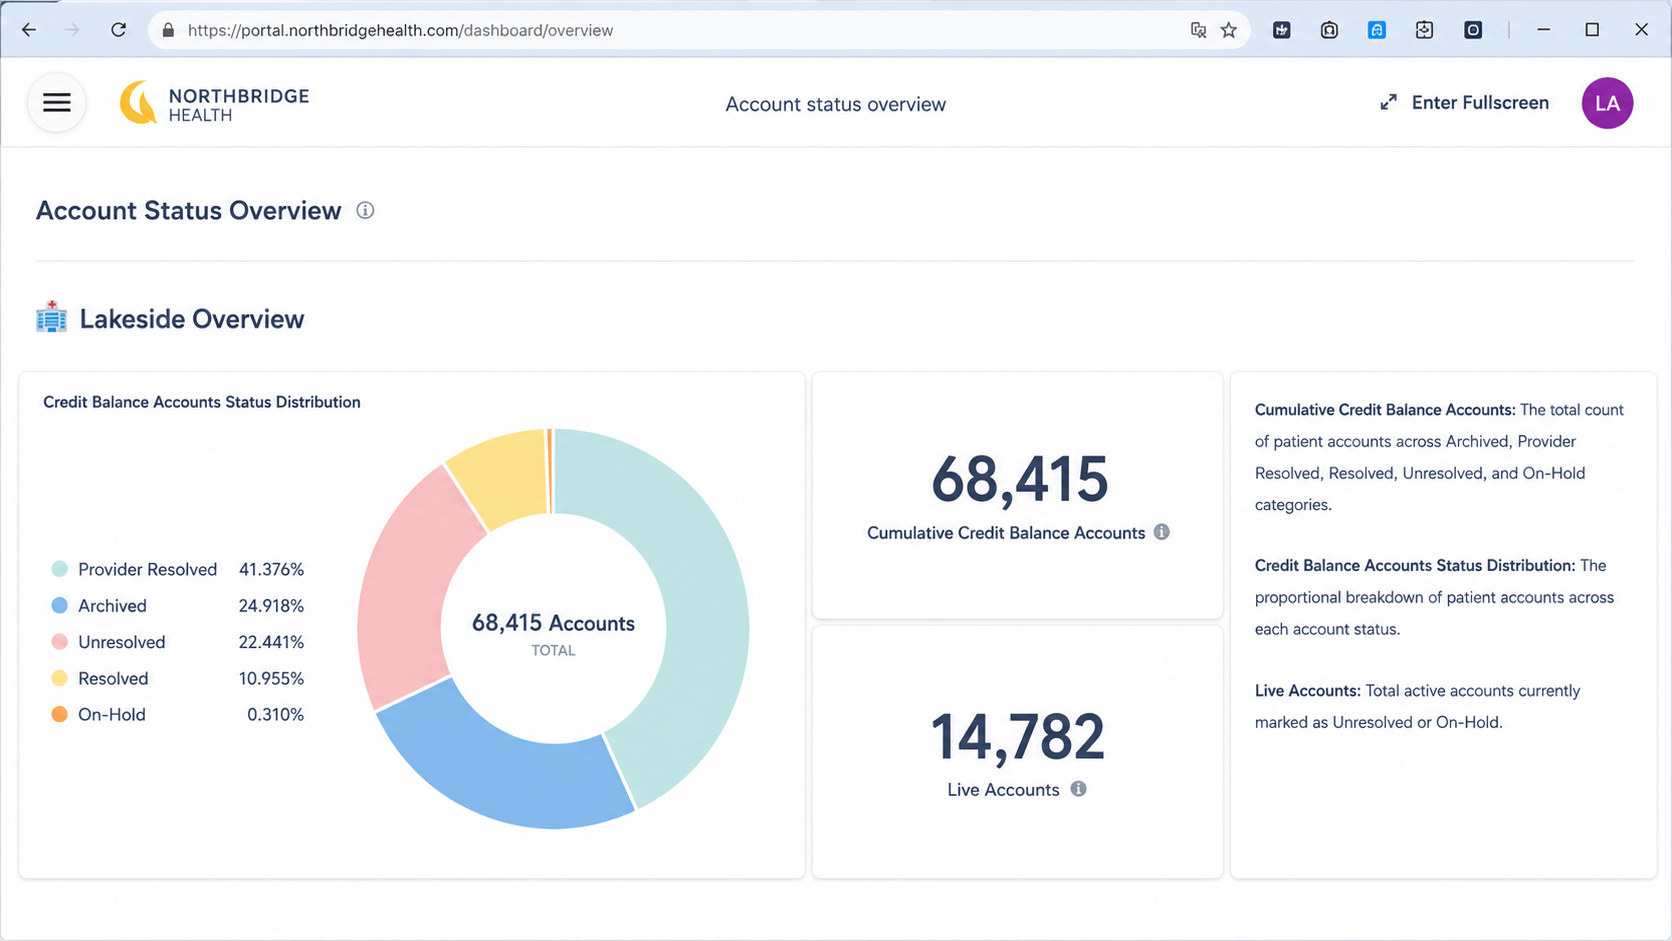
The dashboards embed into a secure, white-labeled Provider Portal. Each client sees only their own data, scoped by facility, department, or service line. Role-based access means a CFO sees a different view than a billing analyst. No custom development. No indication the analytics layer is a separate tool.
Four capabilities:
Self-service analytics. CRH staff and provider clients explore data, build filters, and answer their own questions. Zero tickets.
Real-time dashboards. Resolution velocity. Backlog status. Root-cause trends. Team productivity. All live.
Drill-down access. High-level summary metrics through to underlying transactions in one click.
Automated alerting. Key milestones and anomalies reach clients without manual intervention.
Results
Status inquiry calls dropped 90% in the first month. Every active client adopted the portal within 30 days. Peak usage lands in evenings and weekends, when executives review performance.
Account managers reclaimed roughly half their working time. Client satisfaction scores rose 45%. Contract renewals increased 65%. Zero client departures since launch, against roughly 8% annual churn before.
New client onboarding time dropped 75%. The portal became a sales asset. Hospital systems now expect modern, transparent reporting. CRH walks into pitches with a working demo.
What we learned
Embedding analytics into a production application burdens maintenance and bottlenecks reporting through engineering. We separated the layer. CRH scaled clients without scaling account management headcount.
What started as a reporting fix became a competitive differentiator.
Dig deeper:
- Healthcare RCM Dashboard Deep Dive — Inside revenue cycle analytics for healthcare providers
- HIPAA-Compliant Analytics Portal — Building analytics that meet HIPAA requirements
- How to Embed a Metabase Dashboard — Step-by-step Metabase embedding guide
If your team manages complex operational data across multiple clients and reporting requests are drowning your engineers, get in touch.