
Which stores are holding you back?
Running a franchise network means guessing which locations need help until the P&L lands. One store drags cook times. Another bleeds customers on delivery speed. By the time the reports arrive, the quarter’s gone.
This dashboard ends the guesswork.
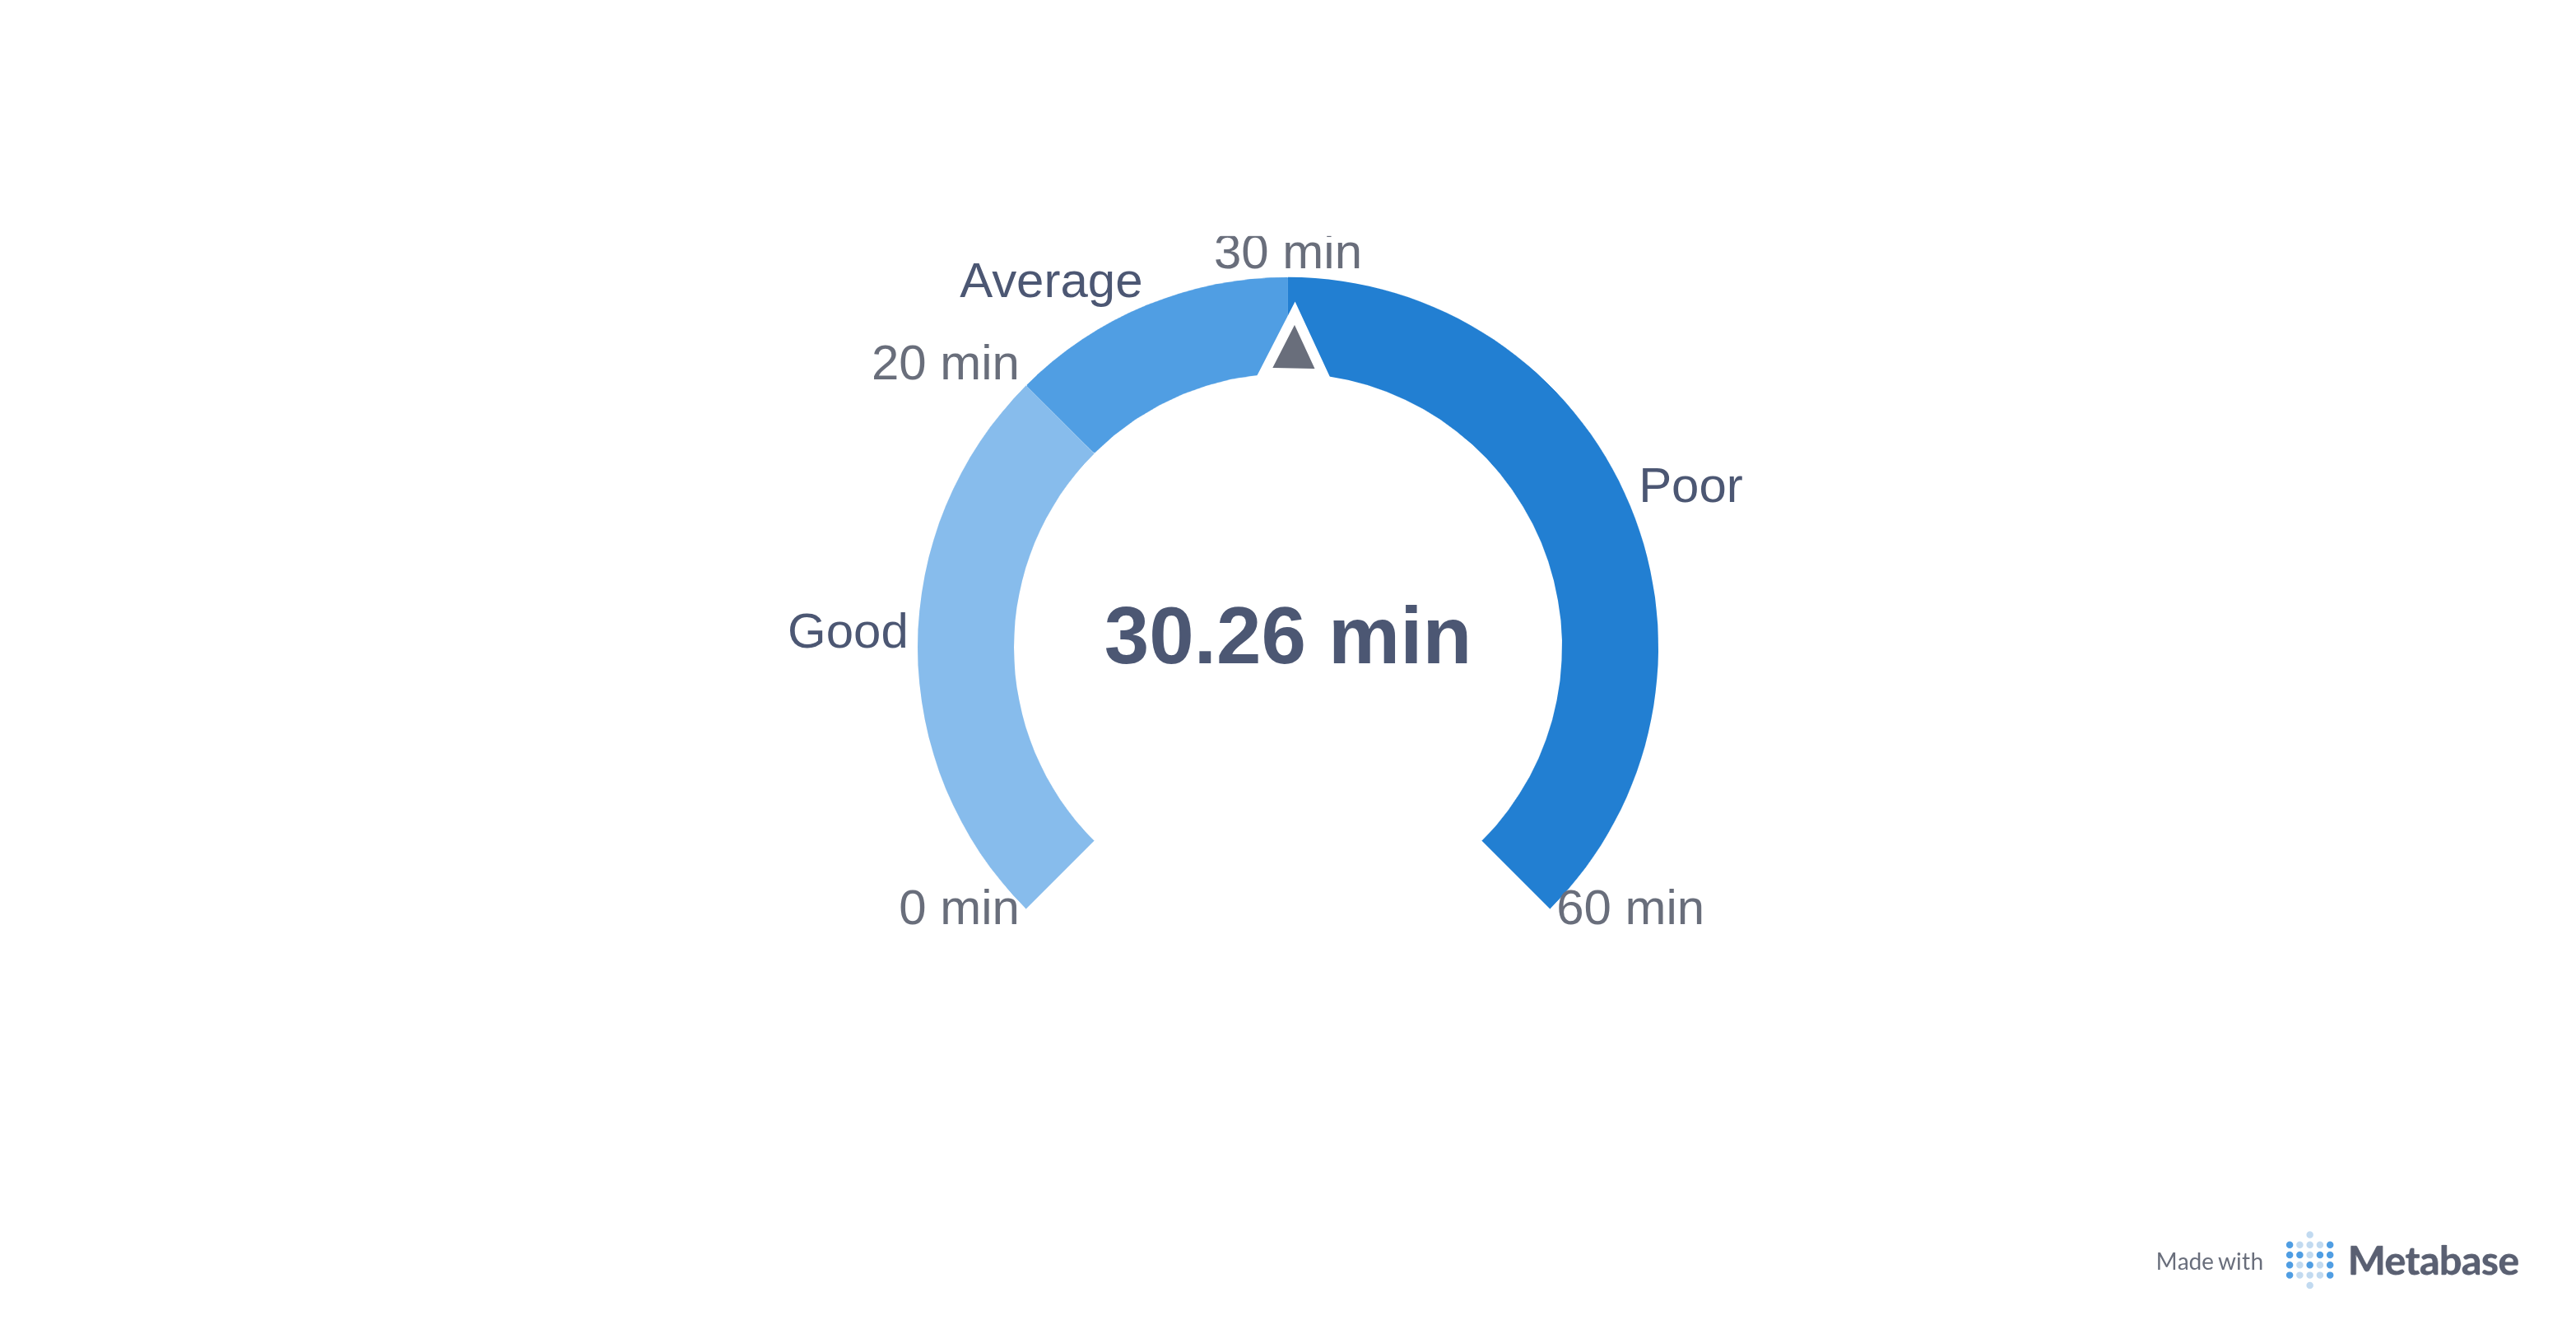
See every store, side by side
Cook time benchmarks. Spot which stores run above or below the industry average, down to the minute.
Delivery speed by region. See where late deliveries cost you repeat customers.
Geographic heatmaps. Identify underserved areas for expansion and saturated zones where marketing spend is waste.
Store-to-store comparisons. Rank every location on the metrics that drive your margins.
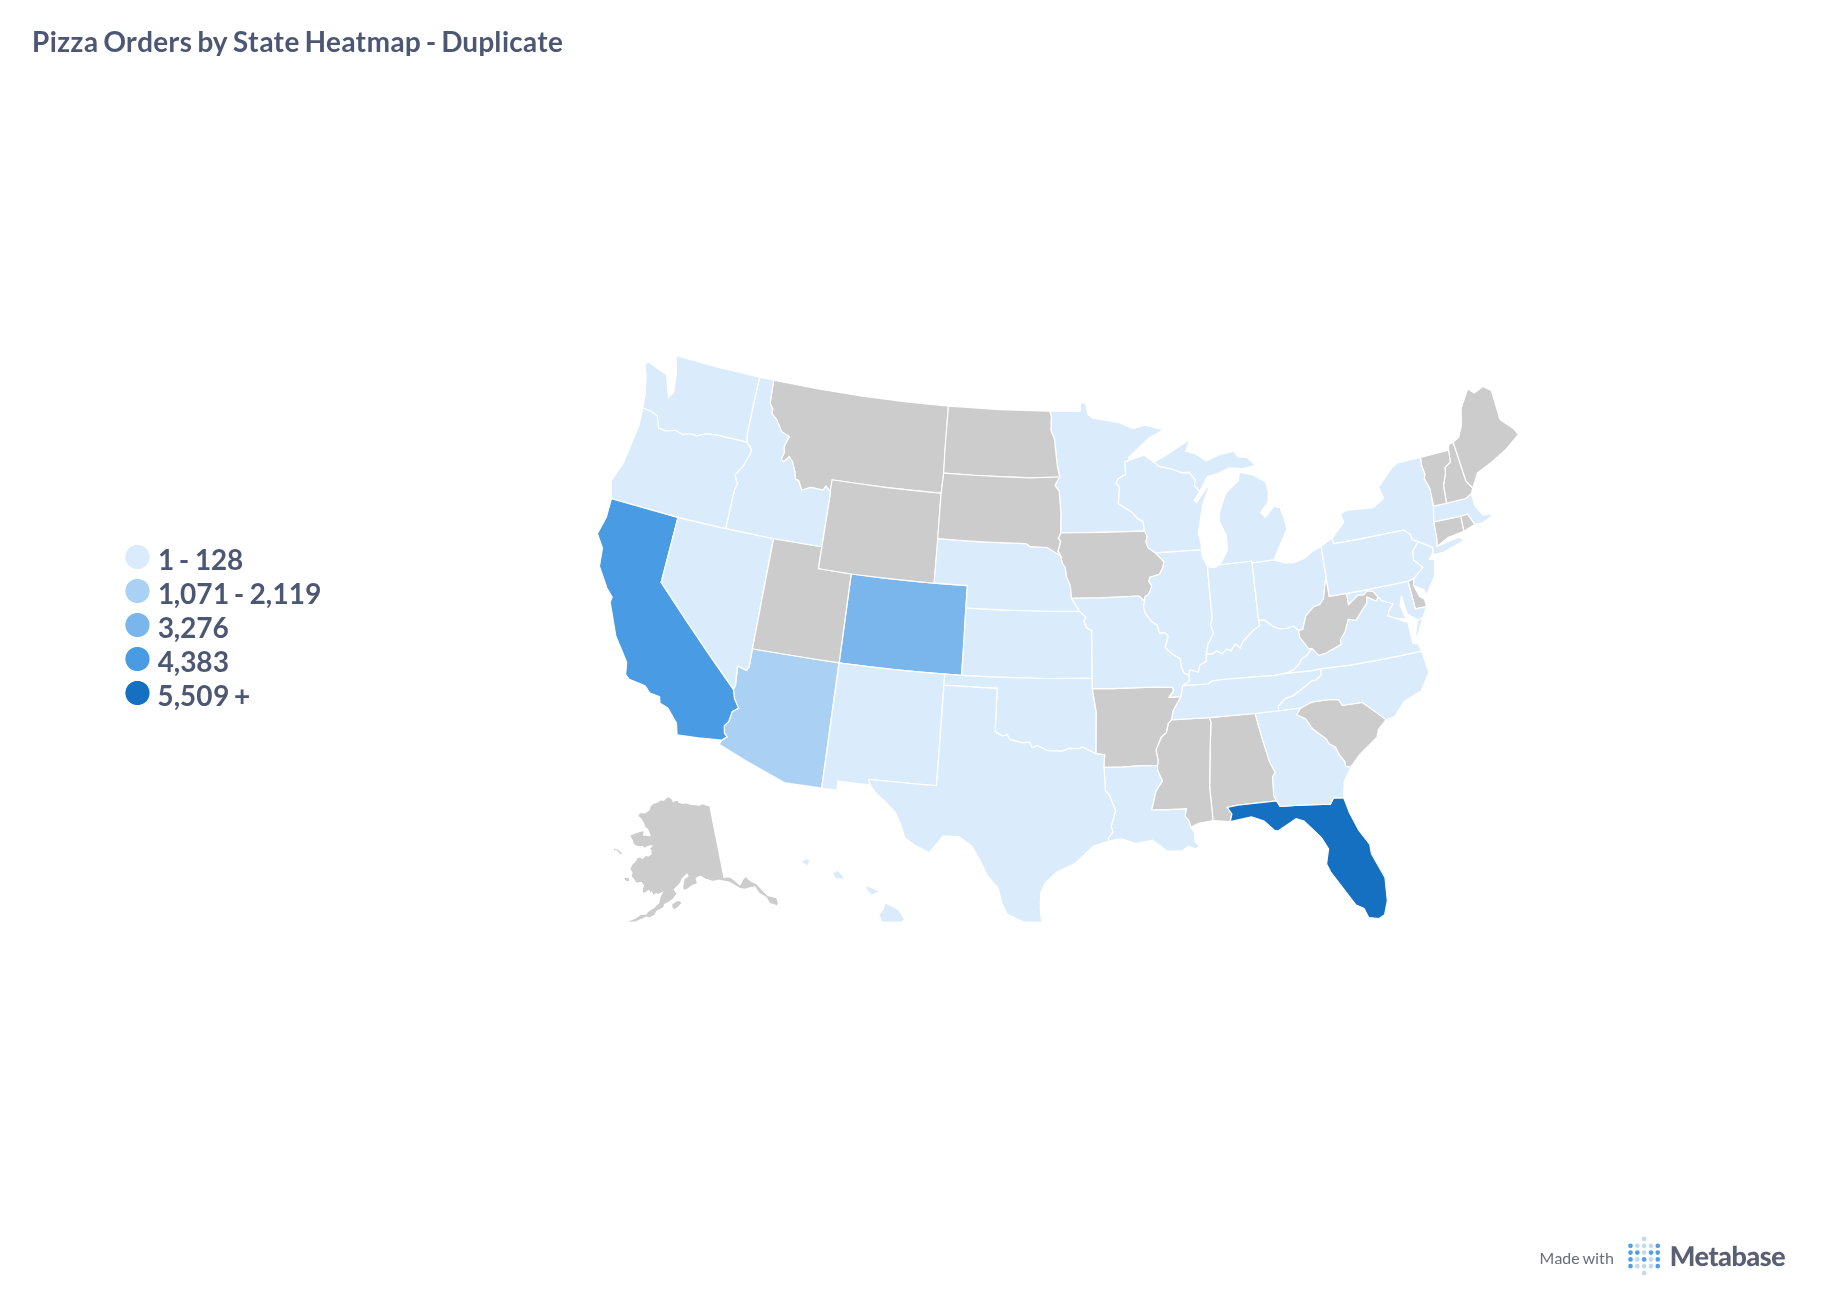
From dashboard to decision
A franchise owner opens this and knows where to send the ops manager tomorrow. A VP of Operations sees which five stores need intervention before next quarter’s numbers land. An investor evaluating a new territory reads demand density instead of a spreadsheet.
We modeled this on real delivery data around the questions franchise leaders ask. The ones vendors never think to surface.
Dig deeper:
- Metabase vs Grafana vs Superset — Compare the top three open-source BI platforms
- PostgreSQL for BI — Using PostgreSQL as your business intelligence backend
See it in action or book a call. We’ll build one for your network.