The headline is already late
AI stocks don’t wait for the news cycle. Capital rotates from chips to cloud platforms in minutes. Institutional money moves before retail sees it. Most investors trade yesterday’s tape.
This dashboard gives you the tape as it prints. Momentum, liquidity, volatility, sector rotation. One screen. Updating by the minute.
Read the flow
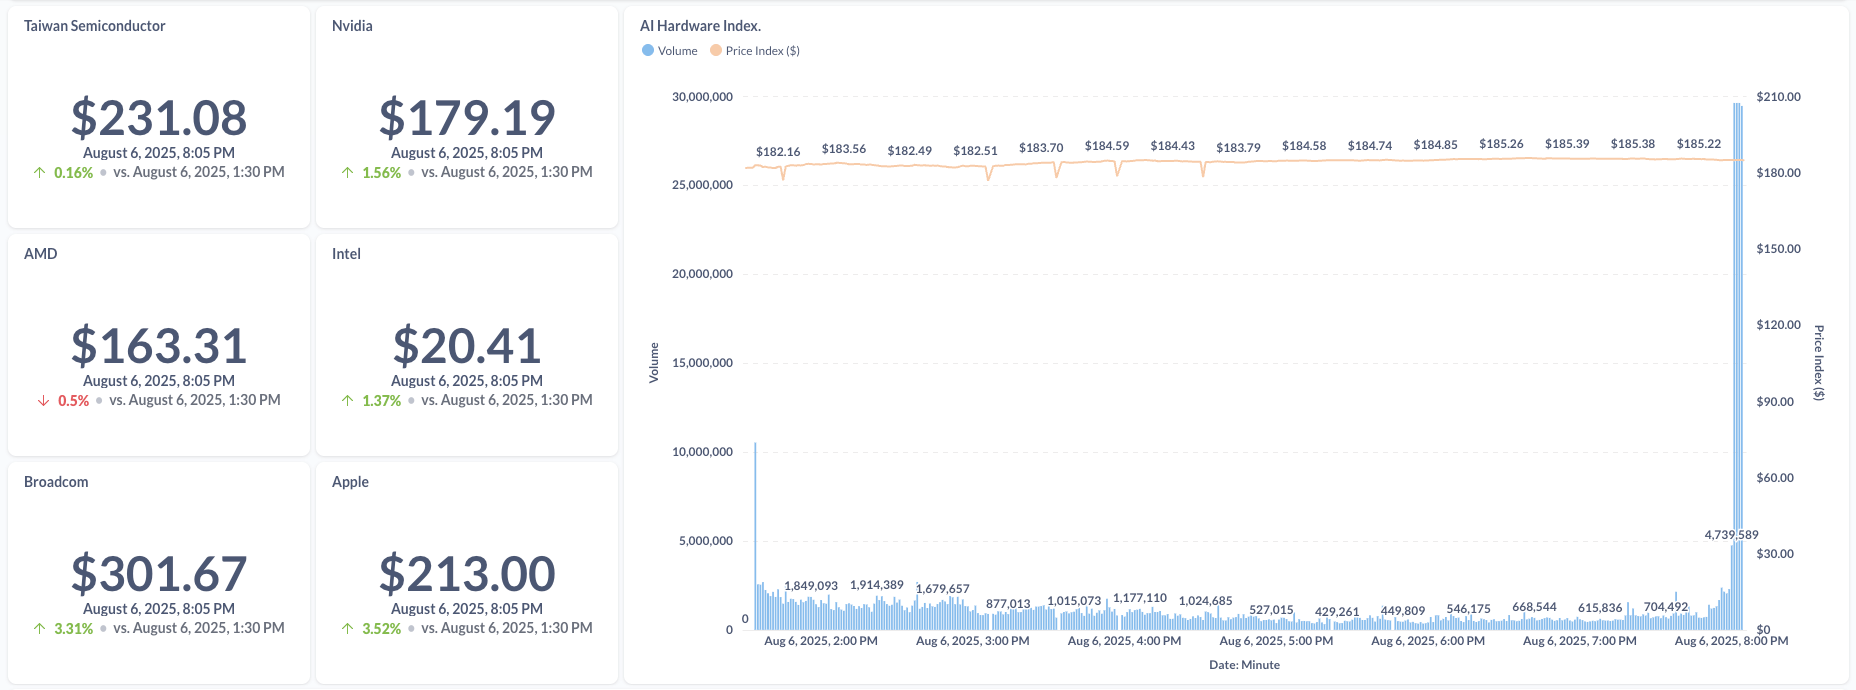
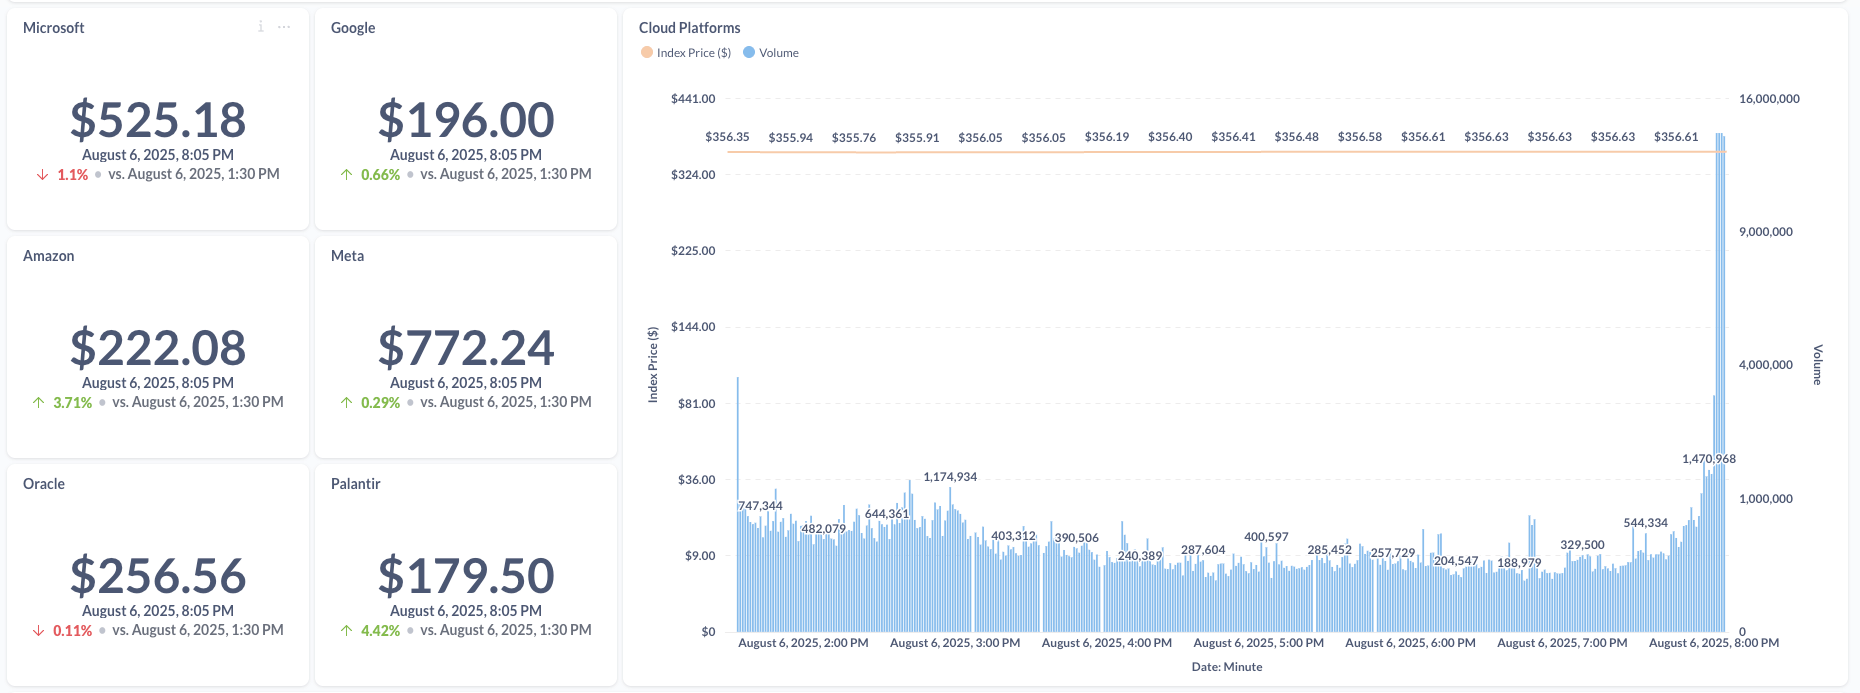
Sector rotation at a glance. See capital moving between Silicon & Hardware (NVDA, AMD, AVGO) and Cloud Platforms (MSFT, AMZN, GOOGL) before the narrative shifts.
Volume conviction. Distinguish genuine institutional accumulation from thin retail spikes.
Volatility signals. Spot when a price move has real participation behind it and when it’s fragile.
Breadth check. The AIQ ETF shows whether leadership broadens or narrows across the sector.
Drill into any name
Click a stock and the Deep View opens: P/E ratio, minute-by-minute price, volume, and volatility together. Each metric updates in lockstep. You can test whether that spike in NVIDIA had real flow behind it or was just noise.
Built for speed
We pull live market data from Yahoo Finance through a pipeline that refreshes in under a minute. Price, volume, and derived metrics stay consistent across every view. Research desk, trading floor, same numbers.
Dig deeper:
- Real-Time Data Pipelines — Architecting pipelines that refresh in seconds
- Metabase vs Grafana vs Superset — Compare the top three open-source BI platforms
Want a working pilot on your market data? Book a demo. We’ll stand it up and iterate until it fits how you trade.